Component-Level Digital O&M
Managing thousands of small devices requires software built for granularity: per-unit data, automatic work orders and remote dispatch.
Key takeaways
- Plant-level monitoring tells an operator how much energy was produced.
- Agree response expectations for monitoring alerts, firmware updates and data availability, and record who is responsible for each.
- Historical data supports lifecycle decisions: when to replace a cohort, whether a component is degrading faster than expected, and how performance correlates with weather and soiling.
What granularity changes
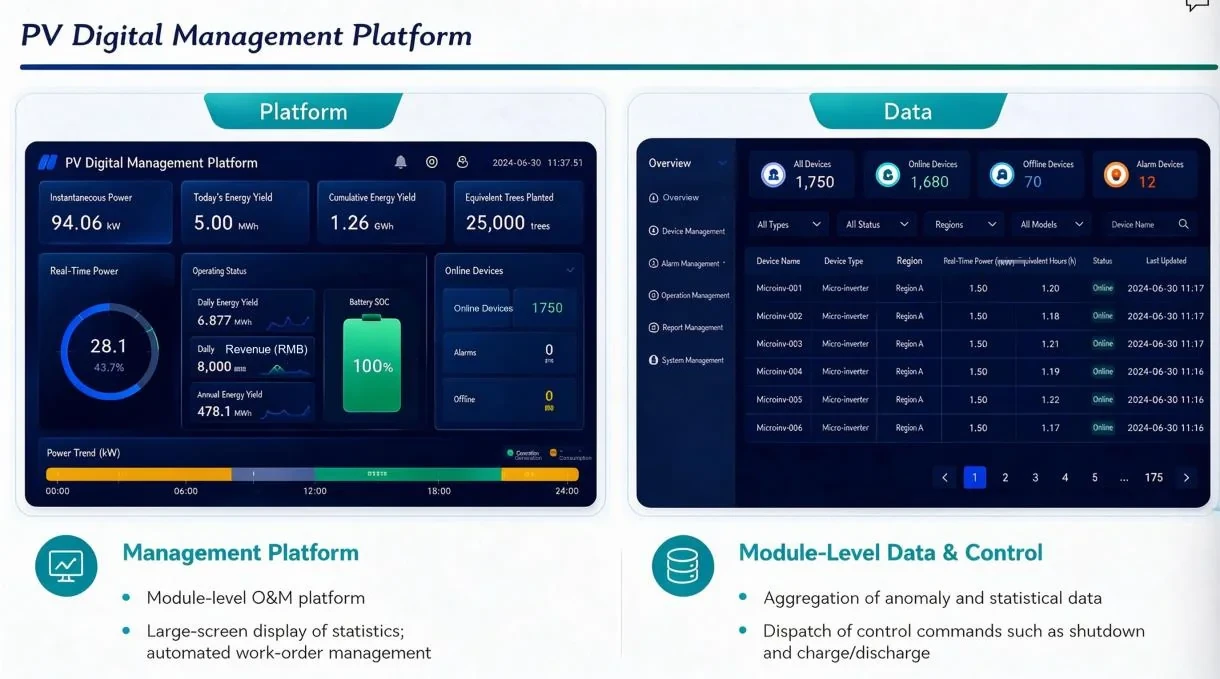
Plant-level monitoring tells an operator how much energy was produced. Component-level monitoring tells them which panels, rows and units are underperforming, which units are offline, and which are running hot. The second view converts a monthly performance discussion into a daily operational one, and it makes small losses visible before they become large ones.
The dashboard as a working tool
A useful platform view combines real-time power, daily and cumulative generation, state of charge and device counts on one screen, with a drill-down into individual units showing power, temperature and equivalent operating hours. Operators use this view for morning checks, not for reporting, which is the practical test of whether a dashboard is worth building.
Automatic work orders
When a device reports an anomaly or goes offline beyond a threshold, the platform can open a work order with the location, the last known state and a suggested action. Dispatching work automatically removes the manual step where alerts are read and forgotten, and it produces the maintenance record that insurers and asset managers ask for later.
Remote command and dispatch
Per-unit addressing allows an operator to command a specific device or a group: shut down, resume, change mode, update strategy. That is the difference between managing a fleet and merely observing it. Fleet-wide firmware updates over the air complete the picture, since they remove the need for a physical visit to every unit.
Service levels around the platform
Agree response expectations for monitoring alerts, firmware updates and data availability, and record who is responsible for each. Wording matters less than clarity: a site team needs to know whether a device alert is answered by their own technicians or by the supplier, and within what time. Ambiguity here is the most common source of operational friction.
Integration with existing systems
Most operators already run a monitoring or ticketing system. Ask how device events can be forwarded into it, whether an interface or export exists, and what format it uses. Integration determines whether the platform becomes part of normal operations or a separate tool that only specialists open, and that difference decides long-term value.
What to automate first
Automate the routine and the repetitive before the sophisticated. Work orders for offline devices, monthly performance summaries and alerts for temperature excursions deliver most of the operational benefit and are straightforward to implement. Analytics that attempt to predict failure come later, once the basic data is complete and trusted by the team using it every day.
Data for the long term
Historical data supports lifecycle decisions: when to replace a cohort, whether a component is degrading faster than expected, and how performance correlates with weather and soiling. Retaining granular history is what turns a monitoring installation into an asset-management system over the plant's lifetime.
Want this analyzed for your plant?
Send your array data and we will return a technical view within one business day.
Literature search entries on Cloud EMS & Digital Management Platform
The entries below open literature search results rather than single papers, so the reading list can be filtered by date, citation count and full-text availability at the source. 24 queries across five indexes, grouped by source.
Google Scholar1
Semantic Scholar1
Baidu Scholar1
IEEE Xplore1
ScienceDirect1
OpenAlex19
- cloud-based energy management system renewable
- digital twin photovoltaic power station
- remote monitoring platform solar PV
- smart alarm linkage PV system
- cloud SCADA distributed energy resources
- artificial intelligence energy management solar
- predictive maintenance PV plant cloud
- big data analytics energy storage
- digital platform for distributed solar
- remote firmware update energy systems
- machine learning solar forecast
- cloud energy management renewable
- IOT monitoring photovoltaic plant
- digital twin energy system
- automated alarm solar plant
- web based SCADA renewable
- data security smart grid
- cloud services distributed generation
- remote optimization PV battery
Take the Numbers With You
The brochure covers the storage rod, the five safety layers, the gateway and the cloud platform. Download it, or send us your site conditions for a proposal within one business day.