The Conversion Chain: Four Stages or Two
Every conversion stage takes a share. Counting the stages between a sunlit module and a delivered kilowatt-hour explains most efficiency differences.
Key takeaways
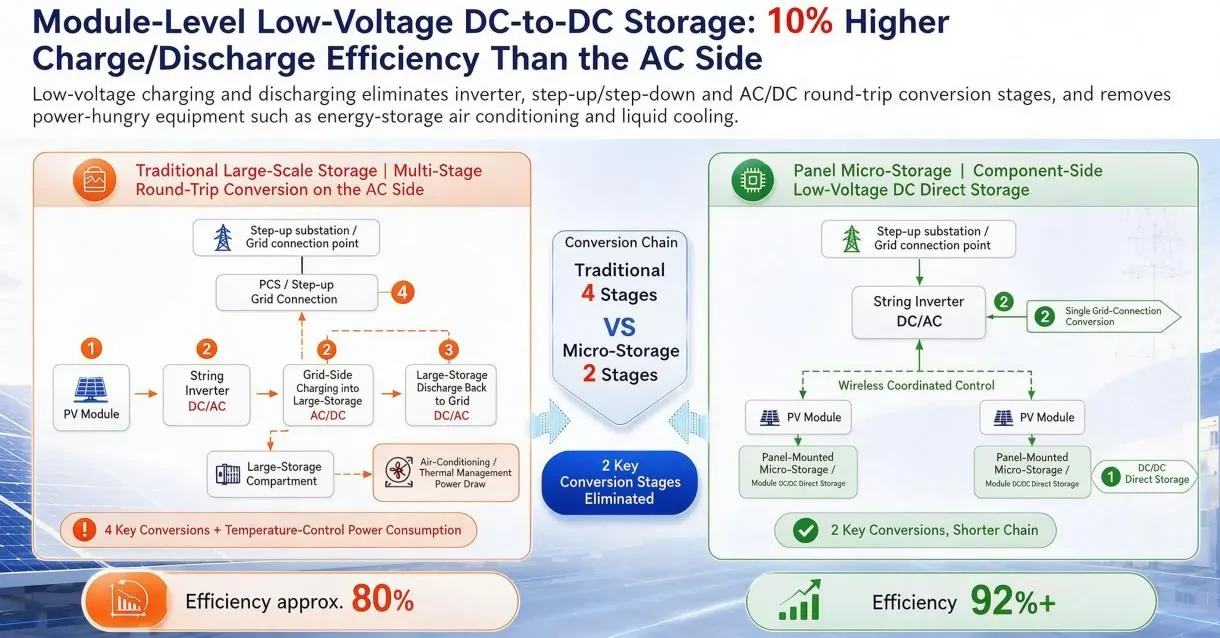
- In a conventional AC-side storage system, energy moves from panel to string, from DC to AC at the inverter, back to DC to charge, and to AC again to serve a load.
- Conversion efficiency is not constant across the operating range.
- Ask for measured charge and discharge efficiency across a temperature range, not a single best-case figure, and ask whether auxiliary consumption is included.
Counting the stages
In a conventional AC-side storage system, energy moves from panel to string, from DC to AC at the inverter, back to DC to charge, and to AC again to serve a load. Four key conversion stages, each with a loss. Board-level DC storage completes the same journey in two: a DC-to-DC stage in each direction, plus the plant's existing grid-tie conversion.
The auxiliary load nobody quotes
Large systems also carry thermal management. Air conditioning or liquid cooling runs continuously in hot climates, and that consumption appears in the plant's own-metered figures rather than in the inverter's data sheet. Passive cooling removes the auxiliary load from the equation entirely, which is why the gap between architectures is wider than the conversion math alone suggests.
The published difference
Round-trip figures of roughly eighty percent for AC-side systems and ninety-two percent or better for DC-side micro-storage are typical in the reference material. That ten-point gap is the headline number, but the operational meaning is more useful: at the same solar input, more energy is available for discharge and export, every day, for the life of the asset.
Where the gap widens
The difference is not constant. It widens in hot climates where cooling loads are heaviest, in plants with long AC runs to a remote battery room, and on sites with many small charge and discharge events per day, since each additional cycle compounds the per-stage losses. Under those conditions, the architecture choice matters more than the cell chemistry.
Accounting for partial-load behaviour
Conversion efficiency is not constant across the operating range. A system running at a fraction of its rated power may be noticeably less efficient than one near its design point, which matters in an application where thousands of small devices operate at low power for most of the day. Ask for a curve, not a single number, and check where the system actually spends its hours.
Testing efficiency at the edges
Low irradiance mornings, hot afternoons and the last hour before sunset are where conversion losses bite hardest, because voltage margins are tight and temperatures are high. Test efficiency at both temperature extremes and at partial load, and compare the results against a conventional architecture on the same site over the same days.
Comparing architectures on one sheet
Put conversion stages, auxiliary loads, expected round-trip efficiency and thermal requirements for each architecture on a single page, with the source of every figure noted. When the numbers and their provenance are visible together, the discussion stops being about which technology sounds better and becomes a question about which assumptions the buyer accepts. That is a conversation a technical committee can actually close.
How to verify a claim
Ask for measured charge and discharge efficiency across a temperature range, not a single best-case figure, and ask whether auxiliary consumption is included. A test that excludes cooling load describes an ideal system rather than the one that will be installed, and it will not match the plant's revenue meter.
Want this analyzed for your plant?
Send your array data and we will return a technical view within one business day.
Literature search entries on Efficiency, Cost & Core Advantages
The entries below open literature search results rather than single papers, so the reading list can be filtered by date, citation count and full-text availability at the source. 24 queries across five indexes, grouped by source.
Google Scholar1
Semantic Scholar1
Baidu Scholar1
IEEE Xplore1
ScienceDirect1
OpenAlex19
- round-trip efficiency DC coupled vs AC coupled storage
- comparison AC side storage DC side storage efficiency
- levelized cost of energy solar PV storage
- photovoltaic mismatch loss module-level MPPT
- energy storage thermal management power consumption
- storage round-trip efficiency optimization
- PV battery system cost reduction
- capacity degradation PV storage
- photovoltaic storage payback analysis
- mismatch losses mitigation PV
- energy storage round trip AC DC
- PV self-consumption rate battery
- economic benefits distributed storage
- heat losses power electronics PV
- availability factor solar storage
- lcoe comparison AC DC coupled
- photovoltaic battery efficiency measurement
- internal rate of return solar storage
- operating cost PV battery system
Take the Numbers With You
The brochure covers the storage rod, the five safety layers, the gateway and the cloud platform. Download it, or send us your site conditions for a proposal within one business day.