Base-Station Economics and Payback
A per-station cost model, the metrics that decide approval, and the assumptions a buyer should verify before signing.
Key takeaways
- For a shared site with roughly twelve kilowatts peak of generation and about forty-eight kilowatt-hours of storage, investment splits into a generation block and a storage block.
- A discharge strategy that empties storage every evening maximizes short-term arbitrage value and leaves nothing for an outage.
- Portfolio scale changes the picture: published projections for ten thousand stations describe cumulative investment in the hundreds of millions, annual savings in the hundreds of millions...
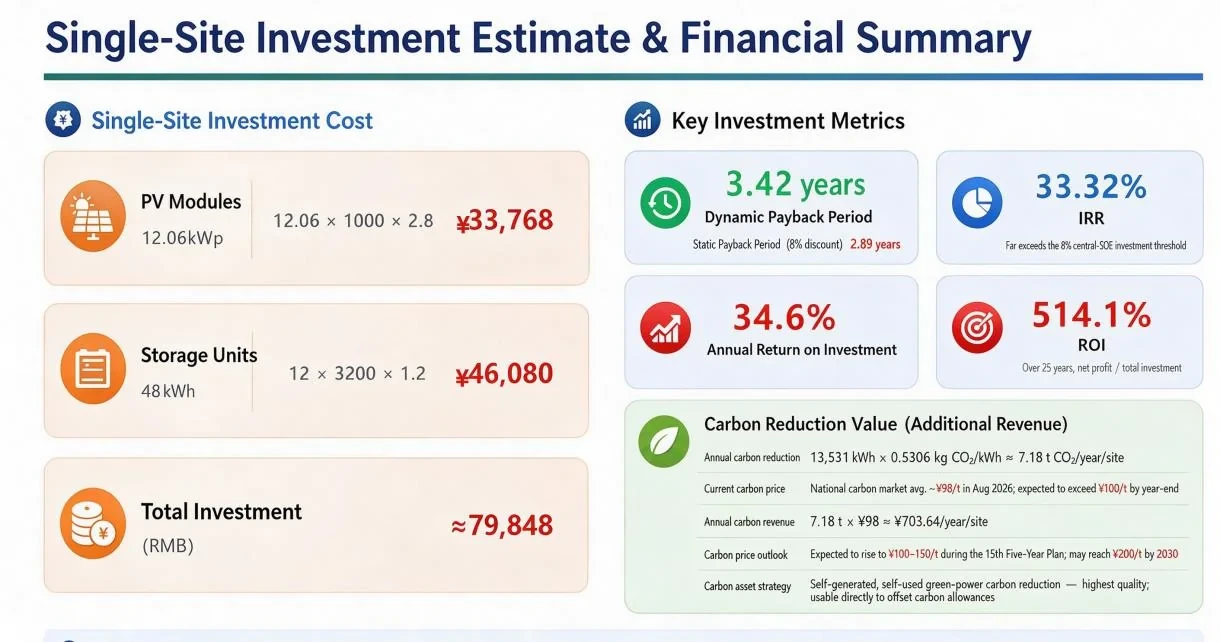
A representative cost structure
For a shared site with roughly twelve kilowatts peak of generation and about forty-eight kilowatt-hours of storage, investment splits into a generation block and a storage block. In a published reference estimate, modules accounted for about thirty-four thousand units of local currency and storage about forty-six thousand, for a total near eighty thousand per station.
The metrics that decide approval
The headline figures in that reference model were a dynamic payback of about three and a half years, a static payback near three years at an eight percent discount rate, internal rate of return above thirty percent, annual return near thirty-five percent and a twenty-five-year return on investment above five hundred percent. Carbon savings were in the range of seven tonnes of carbon dioxide per station per year.
Assumptions to check
Those numbers rest on specific assumptions: an electricity price of around eight-tenths of a currency unit per kilowatt-hour, a twenty-five-year generation life at roughly three hundred and thirty operating days per year, and a storage life of about ten years with replacement budgets at year ten. Move any of these and the payback moves with them, so they belong in the proposal rather than in a footnote.
Market differences
The published model reflects domestic project conditions and should be re-validated for each market. Where diesel is the alternative, the comparison improves; where grid power is cheap and reliable, it weakens. A credible proposal states which benchmark it uses and shows the sensitivity to that benchmark explicitly.
Reserve levels and resilience
A discharge strategy that empties storage every evening maximizes short-term arbitrage value and leaves nothing for an outage. Sites with unreliable grids usually set a reserve, accepting a slightly lower daily return in exchange for generator-free ride-through. The reserve level is a policy decision, and it should be written down and reviewed seasonally rather than left to default settings.
Training the site team
Dispatch policy is only as good as the people maintaining it. Give the local team a short manual covering the tariff bands, the reserve rule, how to interpret the dashboard, what a normal day looks like and who to call about an anomaly. Sites with a trained operator consistently get more value from the same hardware than sites without one.
Comparing markets before committing
Per-station economics vary substantially between markets because the benchmark varies: grid tariffs in one country, delivered diesel in another, generator reliability in a third. Rather than extrapolating one market's result, model the same configuration against each candidate market's benchmark and rank them. That ranking usually differs from the ranking by tower count, and it is the more useful input to a rollout decision.
Rollout economics
Portfolio scale changes the picture: published projections for ten thousand stations describe cumulative investment in the hundreds of millions, annual savings in the hundreds of millions and annual generation in the hundreds of gigawatt-hours. Those figures are projections rather than results, and they should be presented as such, with the per-station model as the auditable core.
Want this analyzed for your plant?
Send your array data and we will return a technical view within one business day.
Literature search entries on Telecom Base Station Green-Power Solution
The entries below open literature search results rather than single papers, so the reading list can be filtered by date, citation count and full-text availability at the source. 24 queries across five indexes, grouped by source.
Google Scholar1
Semantic Scholar1
Baidu Scholar1
IEEE Xplore1
ScienceDirect1
OpenAlex19
- PV diesel hybrid telecom base station
- 48V DC microgrid telecommunication
- solar power system telecom tower
- energy management telecom base station 5G
- green power supply base station feasibility
- telecom power supply renewable hybrid
- 5G base station solar battery
- diesel generator optimization telecom
- DC power system telecom site
- energy efficiency telecom network
- base station photovoltaic system
- off-grid telecom renewable power
- lithium battery telecom tower
- hybrid power supply telecommunication
- solar powered remote telecom
- green energy base station
- battery backup telecom system
- photovoltaic diesel hybrid telecom
- DC microgrid telecom application
Take the Numbers With You
The brochure covers the storage rod, the five safety layers, the gateway and the cloud platform. Download it, or send us your site conditions for a proposal within one business day.