All CasesDesert Region · 100 MW ground-mount
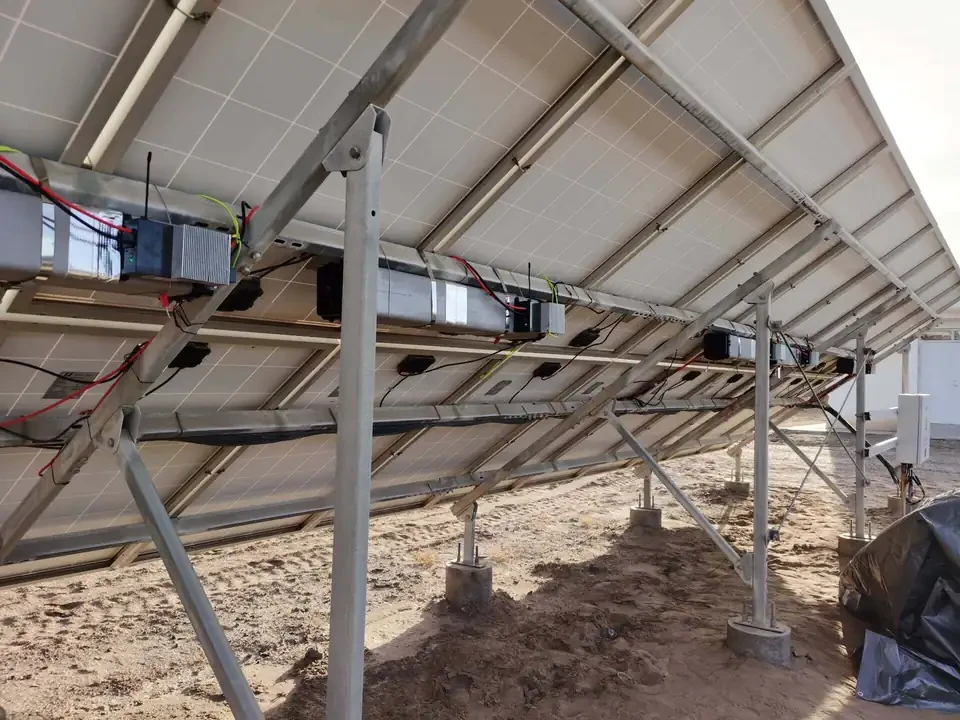
100 MW Legacy Plant Storage Retrofit
An aging desert plant added distributed storage under existing rails - no land, no downtime, phased deployment.
Project Background
The plant had operated for years with rising curtailment and string mismatch losses. The owner wanted storage without reserving new land or stopping generation.
Solution Approach
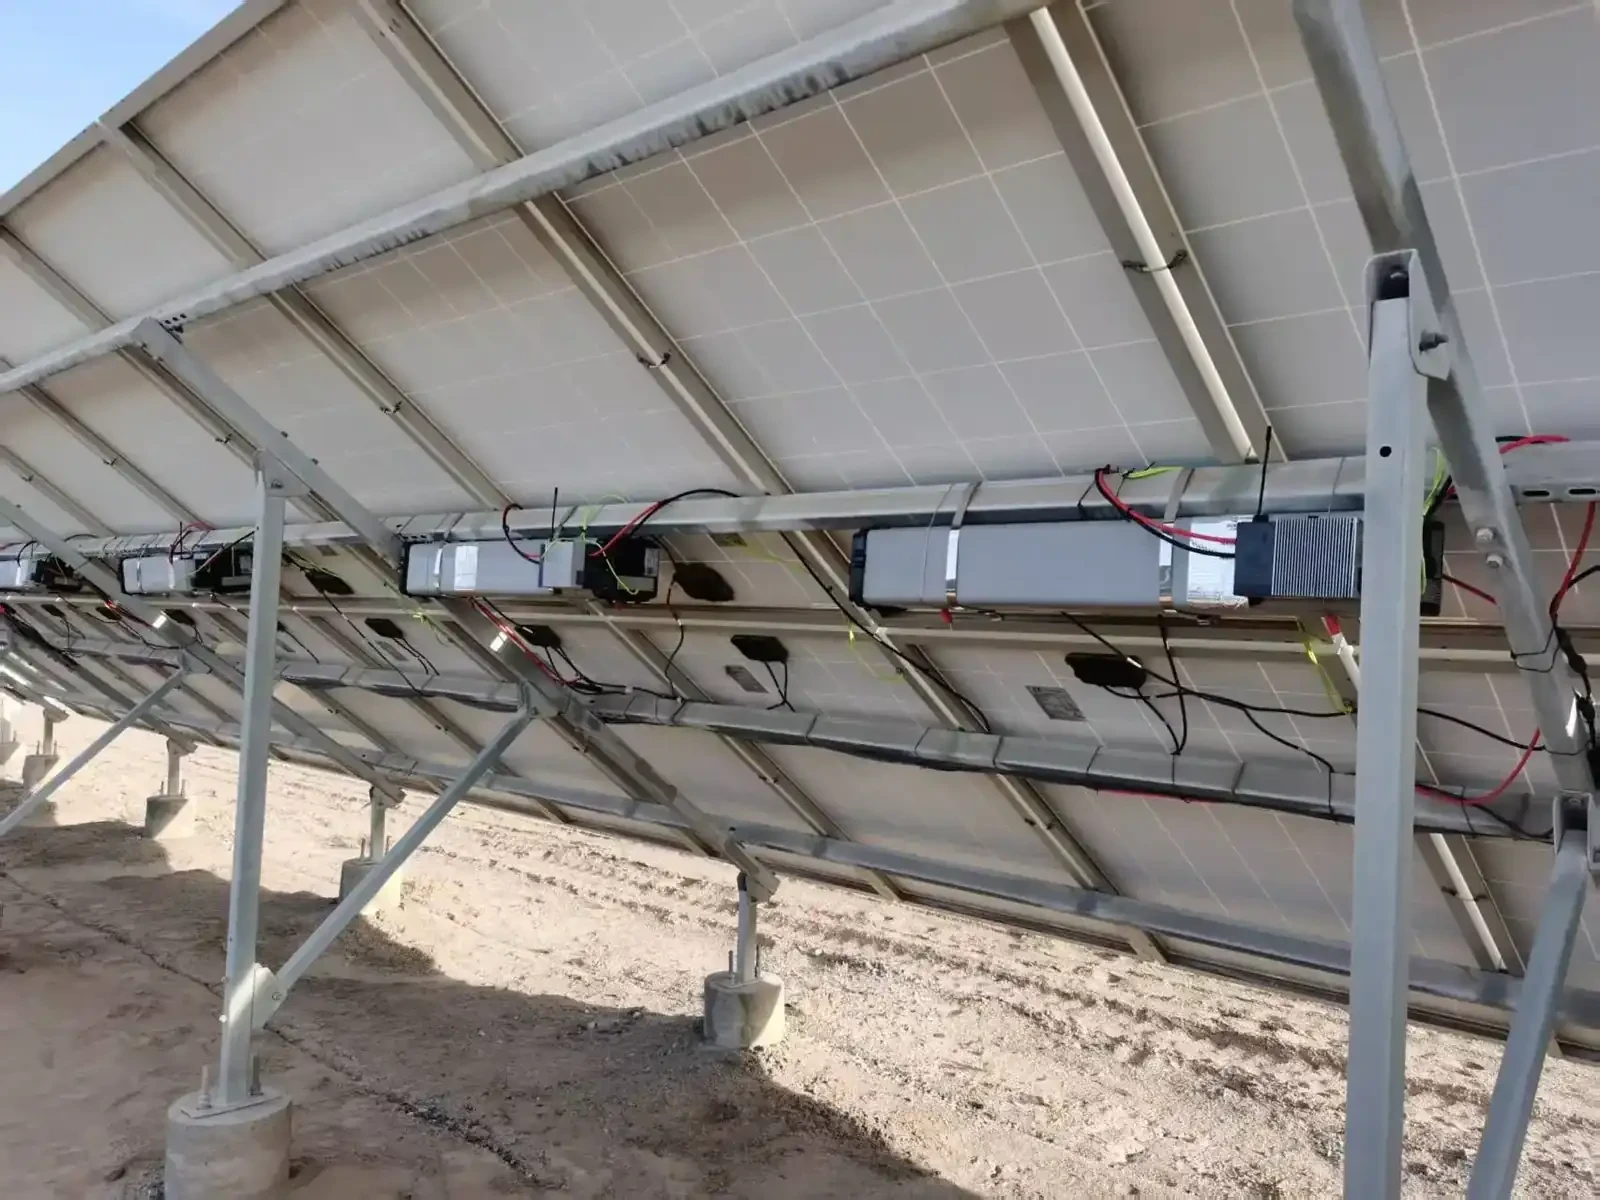
- Storage bars clamped under existing mounting rails, row by row
- Wireless mesh networking with no extra communication cabling
- Bars wired in series with the modules above, installation per string
- Phased rollout while the plant kept exporting power

Feasibility Study
Phase 1 (20 MW), Phase 2 (50 MW), Phase 3 (30 MW) · Full-year 2024, full-year 2025, and Jan–Jul 2026
Curtailment Analysis (2024 / 2025 / H1-2026)
| Phase | Curtailment Days | Annual Curtailment | Peak Single Day |
|---|---|---|---|
| Phase 1(20 MW) | 80.3% / 92.3% / 95.9% | 5.56 / 12.82 / 7.23 GWh | 93.3 / 174.1 / 89.8 MWh |
| Phase 2(50 MW) | 79.5% / 92.1% / 94.4% | 16.70 / 32.02 / 19.58 GWh | 190.9 / 277.2 / 242.6 MWh |
| Phase 3(30 MW) | 74.3% / 92.3% / 95.9% | 8.60 / 17.92 / 11.04 GWh | 135.9 / 158.1 / 139.5 MWh |
Key Findings
- Combined annual curtailed energy doubled from 30.86 GWh (2024) to 62.77 GWh (2025); H1-2026 already reached 37.85 GWh
- Curtailment frequency rose from 74–80% of days in 2024 to 94–96% in H1-2026 — approaching 'curtailed every day'
- Typical curtailment window is midday peak generation (11:00–16:00 core); average chargeable window 6–7 hours
- 4-hour storage outperforms 2-hour: at same power ratio, 4-h annual discharge is 1.6–1.9× 2-h
- At 60% power ratio with 4-h duration, utilization falls to ~67% (about 1/3 usable capacity idle) — balance absorption against utilization
Recommended Storage Sizing
85% delivery-ratio target
Phase 1: 9 MW·4hPhase 2: 25 MW·4hPhase 3: 13.5 MW·4h
Balanced delivery & utilization
Phase 1: 7.0 MW·4h (35% ratio)Phase 2: 20 MW·4h (40% ratio)Phase 3: 10.5 MW·4h (35% ratio)
Ready to Review Your Own Arrays?
Share your plant location and capacity. We will map a pilot layout onto your existing mounting structures.